


Associate Professor Martin Davies and Dr Angelito Calma
Recently, online encyclopedia Wikipedia undertook a study to find out which academic papers were most cited in its more than 44 million online articles. It turned out that a single academic paper was the clear leader.
It’s called Updated world map of the Köppen-Geiger climate classification and was written and published in 2007 by three University of Melbourne academics. It has now been cited by Wikipedia editors over 2.8 million times.

One of the authors, Thomas McMahon, a retired engineering professor from the University of Melbourne, says “it’s a statistic that’s hardly believable”.
But the fact the paper has also been cited in scholarly research across all sorts of fields highlights the importance of tracking citations to discover exactly who is citing who and exactly what they’re citing.

Harnessing the power of experts
Important topics are the ones that get discussed often; influential authors are the ones that get cited most.
Patterns of citation occur cumulatively over long periods of time – sometimes hundreds of years. Old ideas can become new again. Good scientific research requires the continual reappraisal and modification of ideas in the light of new evidence and learning from the published work of others.
While the Wikipedia study is fascinating, suppose we could tell at a glance which topics in a discipline were important – and which authors in any given field were the most influential – over the entire history of scholarship.
By doing this we could determine the ‘geography’ of a discipline area; the ideas, and proponents of important ideas, as measured by the collective opinion of peers over a long period of time.
But it’s very difficult to get that snapshot. Scholars are usually too buried in details to see the wood for the trees.
Until now.
Measuring citation
For decades, the aim of collecting citation data has been administrative – ‘bean counting’ the output of staff. It’s also been used for hiring and firing decisions. This practise is very much widespread, and academic staff obtain points for their publications in an effort to meet requirements for decisions about tenure and promotion. Citation metrics can be used to provide ‘league tables’ of scholarly journals in an attempt to steer research output into areas of specialisation.
However, recently there has been a move to use citation data to tell us something about the character and history of scholarly disciplines themselves, in much the same way as animal droppings tell us something about the diet and social life of animals.

The battle for academic freedom in Europe
Understanding the history of citation data – the trails of scholarly influence – goes some way towards understanding a discipline area. From it, we can see which ideas have currency, which have merit, and which have been marginalised altogether. We can also see clearly the key proponents of those ideas, the movers and shakers, as well.
This work falls under the emerging field of citation network analysis, a sub-field of network science.
What citation analysis can tell us
Research builds. It collects and connects.
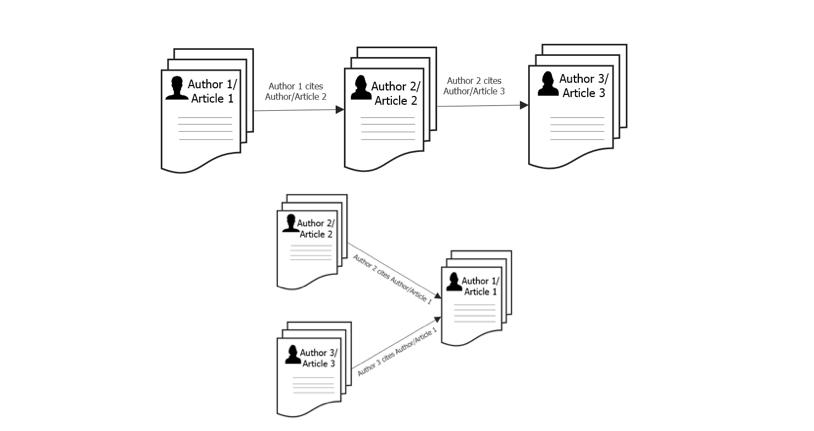
Scholar 1 might cite the work of Scholar 2, who might, in turn, cite Scholar 3. Scholars might cite an article that their peers also think is important. Citation analytics allows us to establish both who cited who (the most cited author/s), and who cited what (the most cited article/s).
This involves counting the number of times the author or article has been cited by other works, referred to as nodes. However, beyond simple frequency counts, citation analysis is usually coupled with network analysis. This investigates the interconnectedness of items in a given population according to citation nodes and links between nodes.
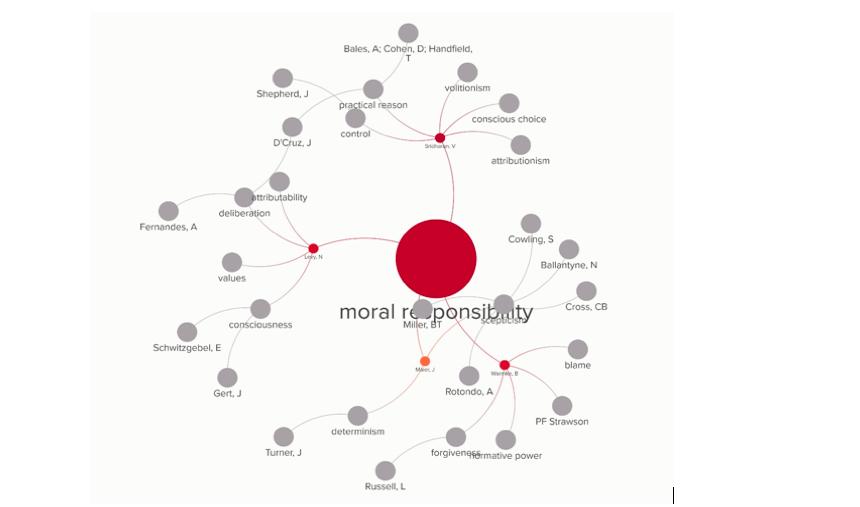
If analysed through the entire life cycle of a journal’s history, and between discipline-specific journals, network analytics can reveal a great deal. But citation networks can be more than a measure of personal influence; they also tell us about the terrain of a discipline. And this is something we discovered by mapping the entire citation history of the Australasian Journal of Philosophy.
Visualising citation
Infographics can map this terrain in an intuitive, visual way. For the first time in history, it is possible to establish a visually complete longitudinal understanding of any area of study. This tells us where a discipline has been and potentially where it might go.

Breaking next-gen scientists out of the lab
In established areas of research like physics, chemistry, biology or philosophy, there is such a plethora of citation data it can be difficult to make sense of. But visualisation tools like Gephi, Kumu and Leximancer provide sophisticated analysis of degree (the number of connections a node has), and closeness centrality (the distance of each node from all other nodes) using community detection algorithms.
The Barabási Lab at the Centre for Complex Network Research, and the Network Science Institute at Northeastern University have worked on showing how citation networks emerge and develop, and how they help us understand complex networks.
Work is being done on areas as diverse as brain networks, administrative data and its role in improving healthcare in hospitals, disease detection, and factors influencing professional success in tennis.
Our own work has investigated trends of importance in management literature. In the field of higher education, we looked at three key journals, analysing their entire histories of citation data and found that:
- UK and Australian journals cite leading scholars regardless of nationality but USA journals predominantly cite other US authors and studies (there is thus an international divide in terms of citation patterns);

- the topics of ‘doctoral education’, ‘assessment’, ‘phenomenography’, ‘student learning’ and ‘identity’ were the principal historical concerns of one key journal in the field;
- topics like ‘academic writing’, ‘widening participation in higher education’, and ‘research training’ have become ‘hot’ topics only since 2010;
- three authors made up nearly 2 per cent of all published articles in one key journal, and authors from the USA, Australia and England make up more than 50 per cent of published articles, with Australian authors having a disproportionate share;

Making learning meaningful
- nearly 15 per cent of all published articles come from 10 institutions across the UK, Australia, the Netherlands, South Africa and Hong Kong;
- there is a split between key authors in terms of theoretical methodologies, in higher education research giving an empirical basis to speculation by others.
Throughout history, the democratic nature of citation-making ensures that good ideas become central and less-worthy ideas become marginalised or dropped altogether. When that information is married with infographic maps, citation networks can provide concrete and illuminating representations of issues scholars regard as important over time.
This has to be good news for understanding the progress of intellectual ideas.
Banner image: Patrick Tomasso/Unsplash
This article was first published on Pursuit. Read the original article.